Advanced Single-cell scATAC-seq & scRNA-seq Dual-omics Analysis: GeneActivity Analysis
Introduction
TIP
GeneActivity analysis infers potential transcriptional activity by calculating chromatin accessibility in the gene body and its upstream regulatory regions, bridging the information gap in single-cell ATAC data where there are "only open regions but no gene expression levels."
In single-cell multi-omics research, scATAC-seq data provides information on chromatin accessibility status but cannot directly reflect gene transcriptional activity. GeneActivity analysis infers whether a gene possesses transcriptional potential by counting the number of fragments within each gene's promoter (usually 2 kb upstream of TSS) and gene body region, followed by normalization to obtain an activity value.
Core Functions of GeneActivity
Gene Activity Inference Calculates the potential transcriptional activity of each gene based on chromatin accessibility (ATAC-seq) data, providing a foundation for gene functional interpretation.
Differential Gene Activity Analysis Identifies differences in gene activity between different cell populations. The analysis method is similar to Differentially Expressed Gene (DEG) analysis, screening for regulatory genes with significantly high or low activity in specific populations by comparing gene activity values across different cell groups (such as cell types, states, treatment groups, etc.).
Gene Transcription and Gene Activity Similarity Analysis Compares the correlation between different cell groups at the levels of gene transcriptional expression (scRNA-seq) and gene activity (scATAC-seq), evaluating the consistency and heterogeneity between epigenetic regulation and gene expression.
This document aims to provide a comprehensive GeneActivity technical guide for single-cell multi-omics researchers, covering its basic principles, operation methods on the SeekSoul™ Online platform, result interpretation, and frequently asked questions, helping you quickly master and apply this tool.
Theoretical Foundation of GeneActivity
Core Principles
The core idea of GeneActivity analysis is: Inferring the potential transcriptional activity of a gene by counting chromatin accessibility signals (fragment counts) within the gene body and its upstream regulatory regions. This process can be summarized in three main steps:
Define Gene Regions: Determine the statistical range for each gene, typically including the gene body and the upstream promoter region (default is 2 kb upstream of TSS). This range encompasses both the core promoter and accessibility during the transcriptional elongation phase.
Count Fragments: Count the number of fragments in each gene region for each cell. Fragments are DNA segments cut by Tn5 transposase in open chromatin regions and serve as the carrier of ATAC signals.
Normalize Output: Normalize the counted fragments to generate a gene activity matrix. In this matrix, rows correspond to genes, columns correspond to single cells, and matrix elements are the normalized fragment counts for gene regions.
Key Concepts
Gene Activity vs. Gene Expression
| Indicator | Data Source | Information Reflected | Common Uses |
|---|---|---|---|
| Gene Activity | scATAC-seq | Chromatin accessibility → Potential transcriptional capacity | Cell type annotation, differential accessibility genes, cross-omics comparison |
| Gene Expression | scRNA-seq | Actual mRNA abundance | Traditional differential expression, functional enrichment, trajectory analysis |
TIP
GeneActivity and Gene Expression are usually positively correlated, but inconsistencies may arise due to epigenetic silencing, post-transcriptional regulation, or technical noise. Comparing the two allows for a deeper understanding of regulatory mechanisms.
Representation of Gene Activity Values
GeneActivity is output as a sparse matrix where rows correspond to genes and columns to single cells. The matrix elements are fragment counts for gene regions. For example:
6 x 3 sparse Matrix of class "dgCMatrix"

                      AAACCCAATGCGTGGCA_1   AAACCCAATGTGCTACT_1   AAACCCACGACATCCGG_1
Hnf4g                                .                      .                       .
Zfhx4                                .                      5                       2
Pex2                                 .                      .                       2
UBC                                  .                      .                       .
1700008P02Rik                        .                      .                       .
Pkia                                 .                      .                       .
Regulatory Region Coverage
The default statistical range is defined as "gene body + upstream 2 kb." This range balances the promoter and transcriptional elongation phases, possessing biological significance while mitigating ATAC data sparsity issues. The upstream extension distance can be adjusted based on the species or research subject (1–3 kb is most common), but consistency must be maintained across the entire data analysis.
Differential GeneActivity Analysis
Once the GeneActivity assay is constructed, differential analysis can be directly performed to identify differences in gene activity between different cell populations. The method for differential analysis is similar to that for RNA data differential gene analysis, identifying genes with significantly high activity in specific populations by comparing gene activity values across different cell groups (e.g., different cell types, different treatment groups).
- Applicable Scenarios: One-time comparison of all cell populations, or specified comparison between two groups (e.g., disease/treatment vs. control).
- Recommended Screening Criteria:
p_val_adj < 0.05,avg_log2FC > 0.25,pct_in > pct_out.
SeekSoul™ Online Operation Guide
On the SeekSoul™ Online platform, the GeneActivity analysis workflow is designed to be intuitive and easy to use. You do not need to write code; analysis can be completed simply by configuring parameters via the interface.
Pre-Analysis Preparation
TIP
The success of GeneActivity analysis largely depends on the quality of input data and the matching of multi-omics data. Before starting the analysis, please ensure:
- Data Preprocessing Completed: Your single-cell ATAC and RNA data have undergone standard quality control, dimensionality reduction, clustering, and cell type annotation.
- Data Matching: Ensure ATAC and RNA data come from the same cells or matched cell populations to enable cross-omics comparison.
- Complete Annotation Information: Ensure the data contains necessary annotation information such as cell types and sample groups for differential analysis and result presentation.
Parameter Details
The table below details the main parameters and their descriptions for the GeneActivity analysis module on the SeekSoul™ Online platform.
| Interface Parameter | Description |
|---|---|
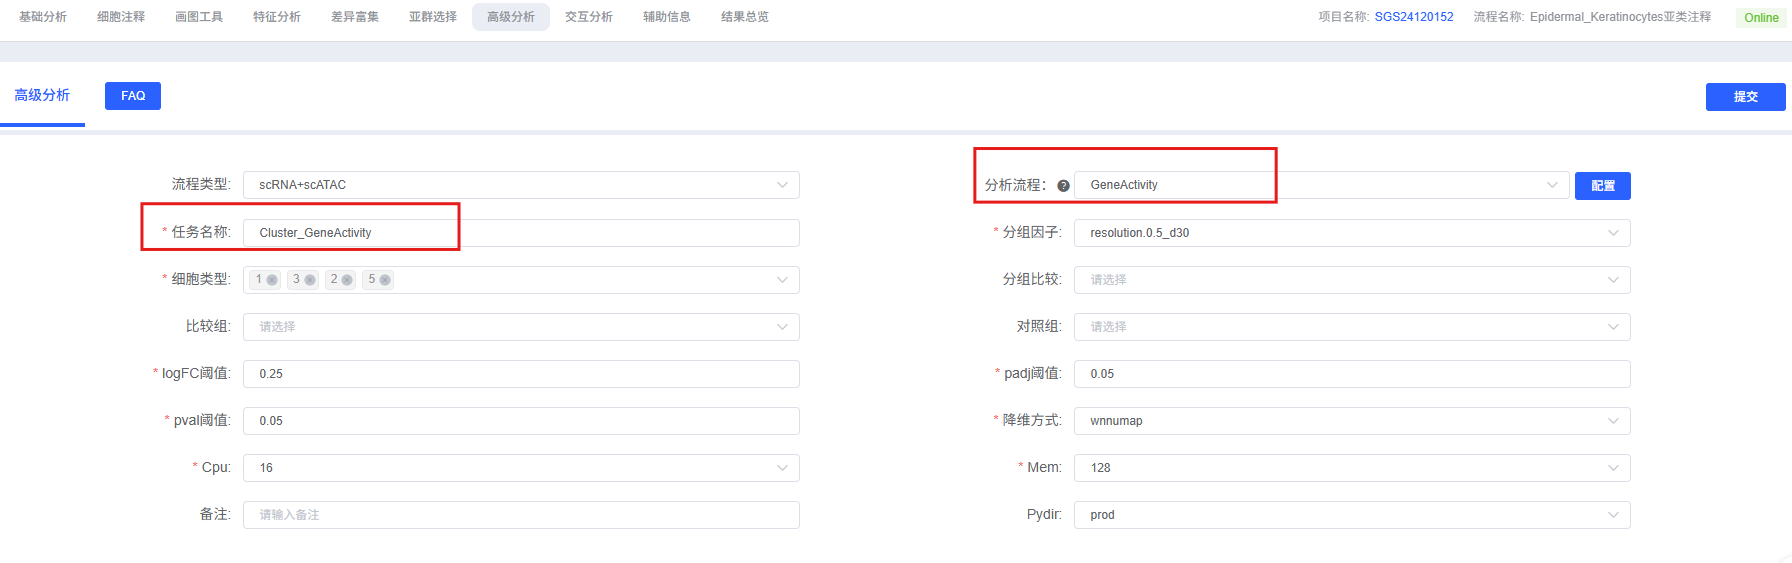
| Task Name | The name of this analysis task, must start with an English letter. |
| Grouping Factor | Select the label corresponding to the cell type or cluster to be analyzed, e.g., celltype. |
| Cell Type | Multiple selection allowed, select specific cell types or clusters to include in the analysis. |
| Group Comparison | Optional, label for grouping when performing between-group comparisons, e.g., Group1. |
| Comparison Group | Optional, consistent with the Group Comparison parameter, representing the experimental group being compared. |
| Control Group | Optional, consistent with the Group Comparison parameter, representing the control group serving as a reference. |
| Split Factor | Multiple selection allowed, label used to split different groups during plotting, such as Group or Sample. |
| logFC Threshold | Fold change threshold, default is 0.25. |
| padj Threshold | Corrected significance threshold, default is 0.05. |
| pval Threshold | Significance threshold (uncorrected significance), default is 0.05. |
| Dimensionality Reduction | The dimensionality reduction method used when visualizing Top differential activity genes via FeaturePlot, e.g., wnnumap. |
Important Notes
TIP
- Data Quality Requirements: Before calculating GeneActivity, ensure fragment files align with cell barcodes and basic QC is completed. Low-quality ATAC data will lead to inaccurate gene activity values.
- Parameter Consistency: Once parameters like upstream extension distance are determined, they should be kept consistent across the entire data analysis to ensure comparability of results.
- Multi-omics Data Matching: When performing cross-omics comparison, ensure ATAC and RNA data come from the same cells or matched cell populations.
Operation Workflow
- Enter Analysis Module: Navigate to the "Advanced Analysis" module on the cloud platform and select "GeneActivity."
- Create New Task: Name your analysis task and select the sample or project to be analyzed.
- Configure Parameters: According to the guide above, select parameters such as cell types, grouping information, and upstream extension distance.
- Submit Task: After confirming parameters are correct, click the "Submit" button and wait for the analysis to complete.
- View Results: Once analysis is finished, view the generated analysis report and result files, including differential tables and visualization charts, in the task list.
Result Interpretation
The GeneActivity analysis report includes various charts and data files. Below is a brief interpretation of its core results. The overall results are divided into two categories: Differential Gene Activity Analysis and Gene Activity vs. Gene Expression Correlation Analysis (Multi-omics Correlation Analysis).
Differential Gene Activity Analysis
Differential Table
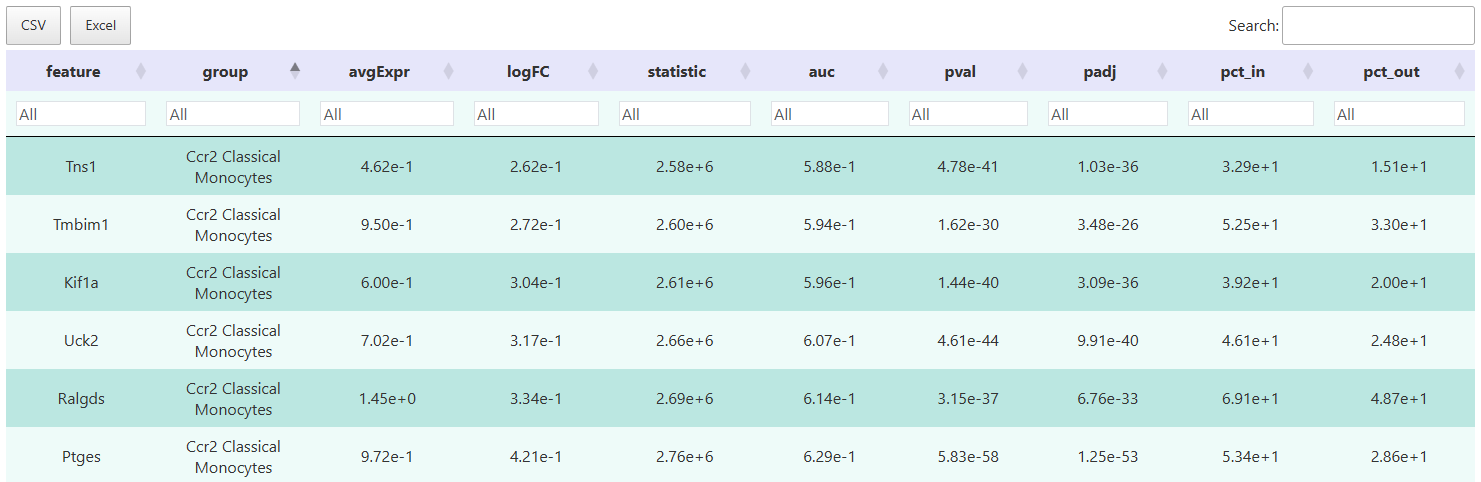
The interactive table allows filtering of target genes based on multi-dimensional metrics such as logFC, p-value, and detection rate. It supports result export for subsequent annotation, functional enrichment analysis, or custom visualization.
The platform generates various visualization results based on Top genes by logFC, integrating ATAC and RNA modalities to assist in identifying key regulatory events.
Result Field Description:
feature: Gene name.cluster/group: Cell type or group label.avgExpr/logFC: Average activity and log2FC.pct_in/pct_out: Detection rates in the target group and background group.statistic,auc,p_val,p_val_adj: Statistical metrics.
FeaturePlot
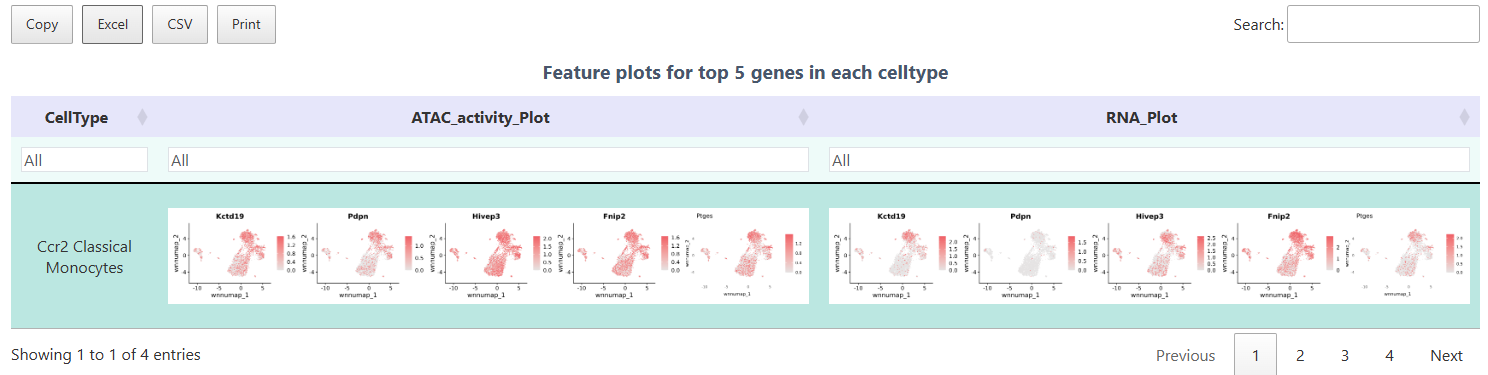
The FeaturePlot function can simultaneously display ATAC gene activity and RNA expression, helping to compare chromatin accessibility levels and transcription levels. Each point in the plot represents a cell, and the color intensity corresponds to the abundance of the target gene in ATAC (activity) and RNA (expression) levels, respectively. Through this plot, one can visually verify the expression and accessibility status of Top differential genes in corresponding cell populations, thereby achieving verification of multi-omics results.
Dual Heatmap
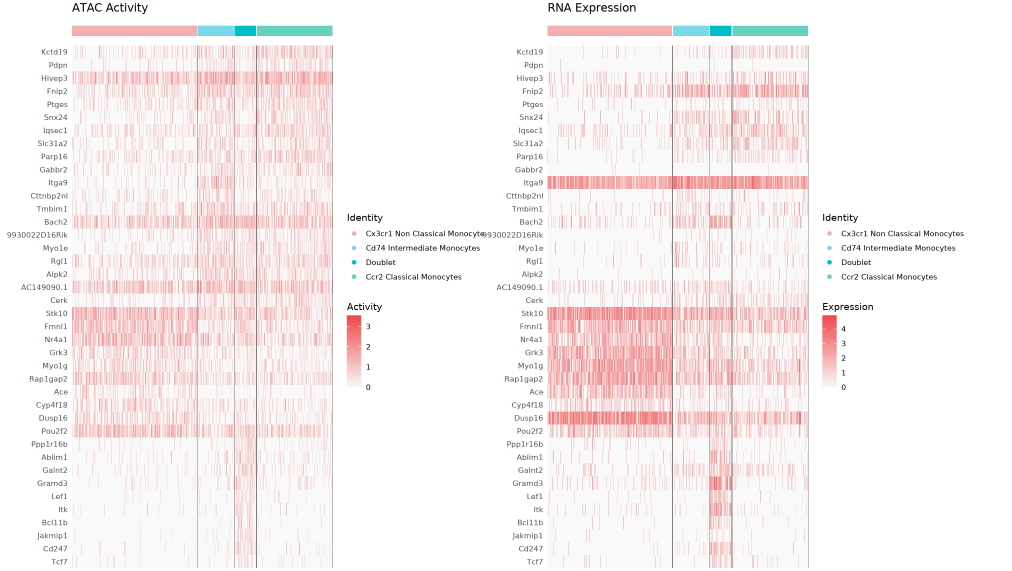
The left side is the GeneActivity (ATAC activity) heatmap, and the right side is the RNA expression heatmap. Each row corresponds to a Top differential gene, each column to a single cell, with different color-coded cell clusters visible at the top. By comparing the two, one can assess the consistency and difference between chromatin accessibility and transcriptional expression, and it also helps to discover special regulatory phenomena such as "open but not expressed" or "expressed but not open."
Violin Plot
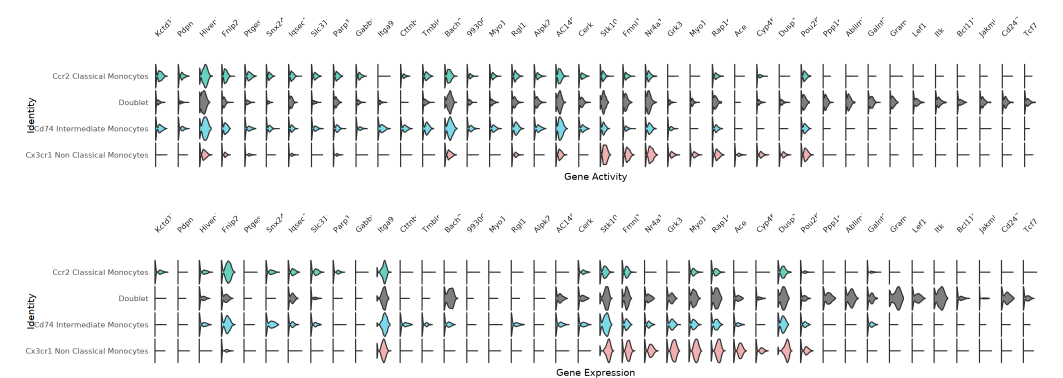
Each gene corresponds to a set of ATAC (gene activity) and RNA (gene expression) violin plots, showcasing the distribution characteristics of different cell populations across these two modalities. This plot helps identify genes with high activity but low expression, or high expression but not high activity, suggesting potential regulatory mechanisms.
Bubble Plot
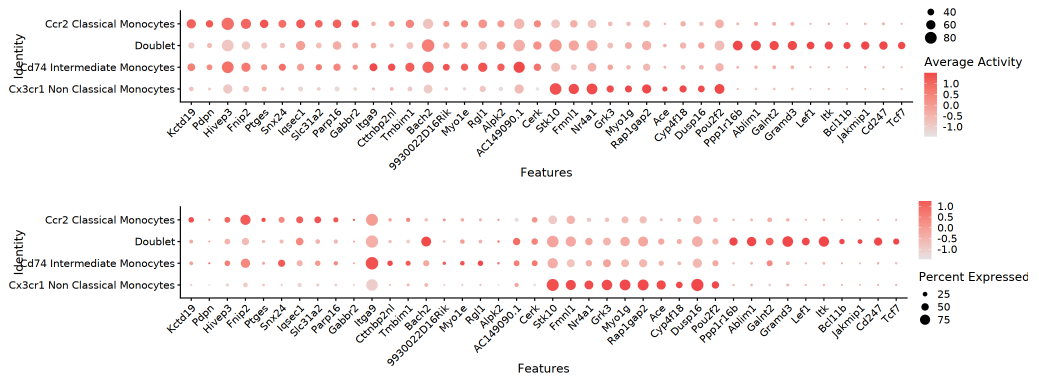
The dual-layer bubble plot displays detection rate (pct_in) via bubble size and average gene activity or expression level via color intensity. In the matrix of cell populations and genes, important differential genes can be conveniently located, efficiently displaying core regulatory features.
TIP: The above visualization methods (FeaturePlot, Dual Heatmap, Violin Plot, Bubble Plot) all reflect the distribution of "Top genes by gene activity fold change" at both RNA (expression level) and ATAC (gene activity) levels. Through dual-modality comparison, key regulatory genes and their matching relationships at the multi-omics level are visually identified.
Multi-omics Correlation Analysis
The focus of this section is to compare the heterogeneity and correlation of different cell groups (types) at the levels of RNA expression and ATAC gene accessibility. The analysis workflow is: first calculate the average RNA expression and mean ATAC gene activity for each cell group separately to obtain mean matrices by cell group; then use Spearman rank correlation coefficient to perform correlation analysis on all cell groups, obtaining correlation matrices for RNA expression and ATAC activity respectively.
- RNA Correlation Matrix: Used to assess the heterogeneity and similarity of transcriptional expression between cell groups.
- ATAC Activity Correlation Matrix: Reflects the consistency or diversity of chromatin accessibility (open status) across cell groups.
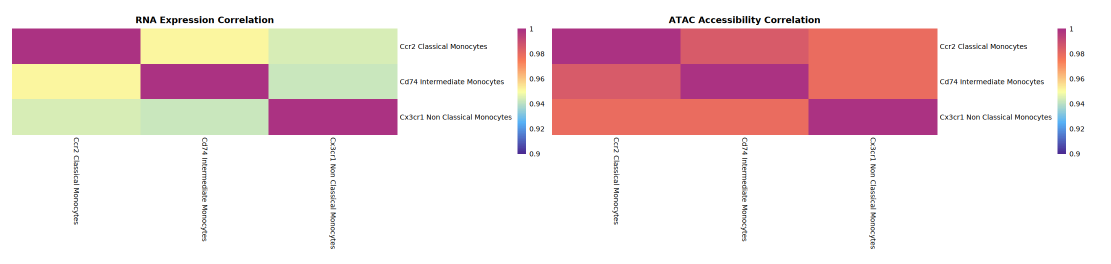
The left side of the correlation heatmap presents RNA expression correlation between cell groups (or types), and the right side displays ATAC gene activity correlation. Both x and y axes represent cell groups. The color of each square represents the correlation coefficient (expression or activity correlation) between the two: redder colors indicate higher correlation, while bluer colors indicate lower correlation. By comparing the heatmaps, one can identify which cell populations are highly correlated at both RNA and ATAC levels, and which show correlation in only one aspect, thereby revealing the consistency or decoupling relationship between epigenetic regulation and transcriptional expression.
Interpretation Suggestions:
- Use the correlation heatmap to observe the overall distribution of correlation between ATAC activity and RNA expression. If correlation at the ATAC level is higher, it indicates that heterogeneity in expression is greater than heterogeneity in gene activity; and vice versa.
- In single-cell multi-omics data, although ATAC peaks accessibility often presents more heterogeneity, at the level of ATAC activity statistically measured by GeneActivity, its heterogeneity is usually less than RNA expression. Specific conclusions need to be further analyzed in conjunction with heatmaps and data to understand the significance of different levels on cell group heterogeneity.
Notes
1. Avoid Over-interpretation: GeneActivity values reflect potential transcriptional capacity, not actual mRNA expression levels. Chromatin opening only represents transcriptional conditions and may still be influenced by repressive histone modifications, lack of key transcription factors, or post-transcriptional regulation.
2. Importance of Parameter Selection: The choice of parameters such as upstream extension distance will affect the calculation results of gene activity. The default "gene body + upstream 2 kb" range balances promoter and transcriptional elongation phases, but can be adjusted according to research needs (e.g., 1 kb / 2.5 kb), and consistency must be maintained across the entire data analysis.
3. Caution in Cross-omics Comparison: When comparing ATAC and RNA data, ensure the data comes from the same cells or matched cell populations. Mismatched data will lead to incorrect conclusions.
4. Results Are Not Static: GeneActivity analysis results are influenced by upstream analysis (such as QC, normalization) and analysis parameters (such as upstream extension distance, differential analysis thresholds). If initial results are not ideal, try adjusting parameters or re-performing upstream analysis.
Frequently Asked Questions (FAQ)
Q1: Why are GeneActivity values not completely consistent with RNA expression?
A: This is a normal phenomenon, reasons include:
- Chromatin opening only represents transcriptional conditions and may still be influenced by repressive histone modifications, lack of key transcription factors, or post-transcriptional regulation.
- Conversely, high RNA but low GeneActivity is often caused by ATAC sparsity or distal enhancer regulation.
- Technical factors: Technical differences such as capture efficiency and sequencing depth between ATAC and RNA data can also lead to inconsistencies.
Q2: Why is "gene body + upstream 2 kb" used by default? Can it be adjusted?
A:
- This range balances the promoter and transcriptional elongation phases, possessing biological significance while mitigating ATAC data sparsity issues.
- The upstream extension distance parameter can be adjusted as needed (e.g., 1 kb / 2.5 kb), but consistency must be maintained across the entire data analysis.
- Different species or research scenarios may require different extension distances; it is recommended to refer to relevant literature or perform parameter sensitivity analysis.
Q3: How to choose appropriate differential analysis parameters?
A:
- min.pct: Recommended to set at 0.1-0.25 to filter out genes detected in too few cells.
- logfc.threshold: Recommended to set at 0.25-0.5, adjusting based on data quality and research needs.
- p_val_adj: Typically use 0.05 as the significance threshold, but can be adjusted according to multiple testing correction methods.
Q4: What input files are needed for GeneActivity analysis?
A:
- ATAC Data: Seurat object or RDS file containing fragment information, with quality control and basic analysis completed.
- Annotation Information: Annotation file containing gene coordinate information (such as GTF/GFF), used to define gene regions.
- Cell Annotation: Metadata containing information such as cell types and sample groups.
Q5: How to interpret inconsistencies in the dual heatmap?
A:
- Open but not expressed: May indicate the gene is in a "poised for transcription" state but is suppressed or requires additional activation signals.
- Expressed but not open: May be caused by distal enhancer regulation, post-transcriptional regulation, or ATAC data sparsity.
- Consistent: Indicates high consistency between epigenetic regulation and transcriptional expression, typical of actively transcribed genes.
Q6: What downstream analyses can GeneActivity be used for?
A:
- Cell Type Annotation: Use gene activity information to assist in cell type identification.
- Differential Analysis: Identify differences in gene activity between different cell populations.
- Functional Enrichment Analysis: Perform functional annotation and pathway enrichment on differential gene activity.
- Cross-omics Integration: Combine with RNA expression data for multi-omics integrated analysis.
- Trajectory Analysis: Combine with pseudotime analysis tools to study dynamic changes in gene activity during cell differentiation.
References
- Stuart, T., Srivastava, A., Madad, S., Lareau, C. A., & Satija, R. (2021). Single-cell chromatin state analysis with Signac. Nature methods, 18(11), 1333-1341.
- Granja, J. M., Klemm, S., McGeough, L. J., et al. (2019). Single-cell multiomic analysis identifies regulatory programs in mixed-phenotype acute leukemia. Nature biotechnology, 37(12), 1458-1465.
- Buenrostro, J. D., Giresi, P. G., Zaba, L. C., Chang, H. Y., & Greenleaf, W. J. (2013). Transposition of native chromatin for fast and sensitive epigenomic profiling of open chromatin, DNA-binding proteins and nucleosome position. Nature methods, 10(12), 1213-1218.